Market performance in the 2nd quarter continued an exceptional period for the equity markets thus far in 2023, with the S&P finishing the quarter up 8.74% and nearly 17% from the beginning of the year. We examine the role of narrow market breadth as a select few names dragged indices higher.
We remember Nobel Prize winner Harry Markowitz, the creator of Modern Portfolio Theory, as his innovative research led to foundational elements of asset allocation and portfolio diversification. With that lens, we examine the time-concentrated nature of recent market performance and index composition.
Though recent equity market performance has been a respite for weary investors, and the Federal Reserve appears to be at least slowing down their tightening cycle, we are skeptical that we are out of the woods on issues like inflation and a potential recession.
Second Quarter Recap
Equity markets continued their rally in the second quarter, shrugging off a variety of concerns to post exceptional gains. Domestic large cap stocks topped the leaderboard, as the S&P 500 rose +8.74% during the quarter to bring the benchmark index’s year-to-date gain to +16.89%. Small and mid-size U.S. public companies generated solid gains, as the S&P Mid Cap 400 index rose +4.85% for the 3 months, and the S&P Small Cap 600 index advanced +3.38%. International equities moved ahead, but lagged their U.S. counterparts. The MSCI EAFE Index of developed international companies was up +3.22% for the quarter and the MSCI Emerging Markets advanced +1.04%. Bond yields rose during the quarter, with the 10-year Treasury yield up 33 basis points (+0.33%), which produced a decline in the U.S. Aggregate Bond index of -0.84%. The NASDAQ composite index of growth stocks was the standard-bearer during the recent period, rising +13.05% during the second quarter, bringing its year-to-date return to +32.32%. This year’s rise in the NASDAQ is the 3rd-largest 6-month move in its history.
Old Lessons, New Again
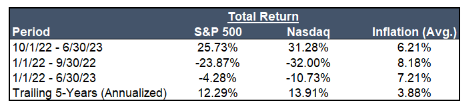
While the quarterly and year-to-date equity market headline returns are exceptional, the underlying story of the market’s advancement isn’t without caveats. Narrow focus and short time periods distort the bigger picture, making additional analysis necessary. We’ve written previously about the symmetry of markets and the convergence of returns over time. Recent market history provides some remarkable examples of these themes. For reference, we have included below a table comparing the returns over 3 time periods of the S&P 500 index of large-company stocks, including both growth and value-oriented companies along with those of the technology-heavy NASDAQ composite index of growth-oriented companies.
The returns show both a remarkable symmetry as well as a check on the exuberance around this calendar year’s rally. In fact, both indices have produced negative returns over the prior 18 months, with the NASDAQ down nearly -11% from its close at year-end 2021. Finally, the 5-year returns of both indices are quite remarkable – they’ve both generated greater than 12% annualized (!) returns. Those metrics were produced during just 60 months that saw three separate drawdowns of over -20% from the market’s prior highs – in the fourth quarter of 2018, the first quarter of 2020 and the first 9 months of 2022.
Source: YCharts
A few things stand out from this simple data series and how humans generally feel about investment returns. First, recency bias is a powerful driver of the strong emotions involved in investing. We as humans really do anchor much of our thinking in the comfort of seasonal and annual markers of time, such as calendar years. Each year-end we all literally and figuratively turn the page on the prior year and look forward optimistically to a fresh start. This past December “closed the books” on a brutal year for investors, who were comforted only slightly by generally positive fourth quarter returns. At the midpoint of 2023, those same investors are relatively euphoric at how much better this year is than last, even though they’ve not yet achieved the heights of the close just 18 months ago (year-end 2021).
Next, timing (for which valuation is a proxy) really does matter. Consider for a moment the example of 3 sample investors: Investor A entered the stock market at year-end 2021, Investor B on October 1, 2022, and Investor C on July 1, 2018. Investor A has experienced a -25% drawdown and the corresponding rally, but is still behind where they started on an absolute basis, while they have seen their purchasing power further-eroded by inflation. Investor B, who put funds to work at the end of the third quarter last year, likely feels like stock market investing is relatively easy (and lucrative!), and is buoyed by inflation trending down during the same period. The veteran, Investor C, could be forgiven for feeling a bit weary, but also proud of having remained resolute in remaining invested through a remarkable period in market history. The fact they would have nearly doubled their money in the 5 years would provide extra comfort. Finally, diversification still (really) does matter, though it sometimes can make investors feel remarkably ignorant…until things change. We examine this last point in more detail below.
Harry Markowitz, the Magnificent Seven, Market Breadth, Al Euphoria, and the Omnipresent Fed
Harry Markowitz (left) passed away on June 22nd at the age of 95. He received the 1990 Nobel Prize in Economics, primarily for work in his 1952 writing titled “Portfolio Selection”. This groundbreaking research became known as Modern Portfolio Theory (“MPT”). Prior to Markowitz, popular consensus around
portfolio construction was focused on selecting investments that offered the best risk/return characteristics in isolation. A portfolio was considered diversified if it contained only individual investments with the risk/return characteristics the investor desired. Put differently, before MPT was popularized, conservative investors tended to shun all but the lowest-risk assets generally and those seeking higher returns focused solely on higher-risk investments. MPT showed that individual assets should be evaluated by how they impact a portfolio’s overall risk and return profile, allowing investors to more broadly-diversify their portfolios while improving returns and reducing overall risk. Markowitz proved that the combination of differentiated, i.e. lowly-correlated assets, created a more efficient portfolio over time.
Investors had always generally understood the benefits of diversification but lacked a structured way to effectively implement it in their portfolios. MPT helped create a systematic portfolio construction process that allowed investors to combine lower- and higher-risk investments and generate more-efficient portfolio returns. Markowitz’s work dramatically upended the way money was managed, but also how capital was allocated more broadly. It is not hyperbole to suggest that MPT was a foundational element of the postwar expansion of the U.S. and global economies. This singular thinker changed the course of economic and actual history, and it is worth pausing to remember him and also to consider what he might have thought about market returns in 2023. Importantly, MPT focused primarily over longer periods of time during which correlations proved resilient. Crisis events, which cause correlations to converge, showed that even a well-diversified portfolio could suffer significant losses due to investor panic and liquidity vanishing. Market history and research since Markowitz’s groundbreaking work helps investors identify conditions that suggest correlation convergence – a point we will return to below.
This year’s and the second quarter’s returns are remarkable enough to merit further examination of what has actually been happening “under the surface” and considering the relative risk of certain assets in the context of their recent returns. A few things stand out, in particular how incredibly narrow the rally’s leadership has been. In other words, a relatively small number of sectors and companies have generated significant outperformance in comparison to their peers and have dragged market returns higher as a result. We see this in the NASDAQ’s outperformance against the S&P 500, but also more-specifically in the quarterly returns of the Technology, Consumer Discretionary and Communications sectors which gained 15.4%, 13.8%, and 12.5%, respectively, in comparison to all others.
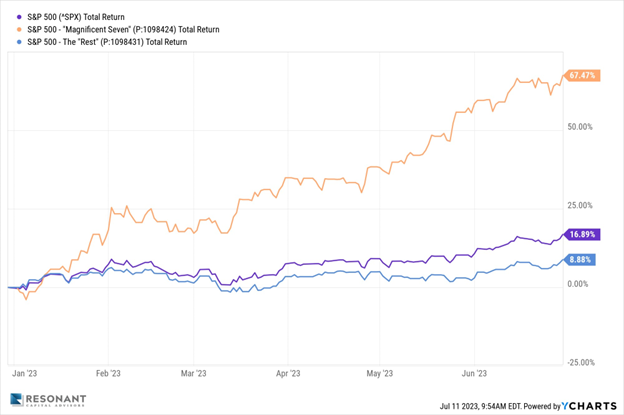
Indeed, the remaining eleven sectors produced negative returns last quarter, and the Utilities (-2.54%) and Energy (-1.12%) sectors were the worst-performing sectors during a period that otherwise delivered positive performance. How? The incredible surge in a very small number of very large companies. The so-called “Magnificent Seven” companies (Google, Apple, Amazon, Microsoft, Meta, Tesla and Nvidia) have driven an outsized portion of the S&P 500’s returns, but especially the performance of the NASDAQ index. Illustrated in the chart below, these 7 stocks together rose 24.2% on the quarter, are up over 67% year-to-date and now represent approximately 31% of the total market capitalization of the S&P 500. As a means of comparison, Apple’s current market capitalization of over $3 trillion exceeds that of all of the 2,000 companies that make up the Russell 2000 index combined. Apple is currently trading at a nearly-32-times price multiple of its earnings. Nvidia has a Price/Earnings multiple of over 222 times! These data points are historically divergent from traditional market dynamics, not to the downside as so many investors fear, but in the opposite direction. What else was happening during the quarter to drive this type of price action? As it turns out, quite a lot.
Source: PiperSandlerCornerstone
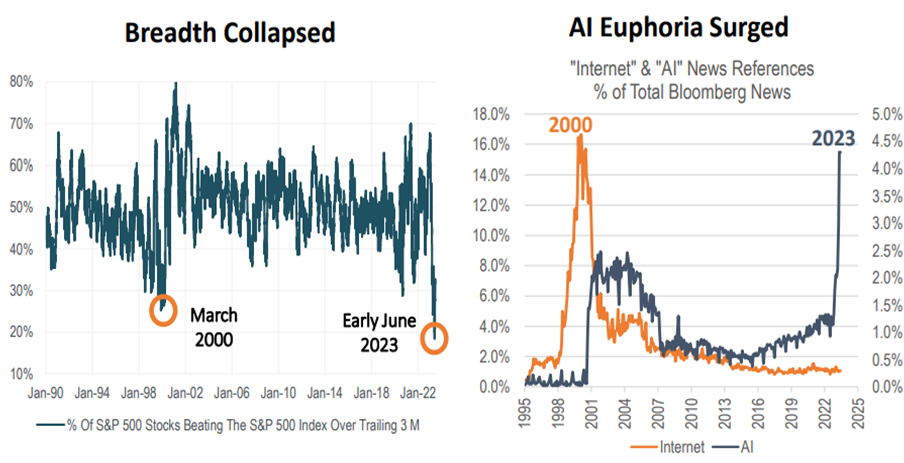
The main “new news” in the second quarter had to do with Artificial Intelligence. We will almost certainly write more in the future about AI, and what it represents. For now, we are of the view that investor expectations have likely outpaced the near-term reality of the benefits of this technology. And we are concerned that this has masked some of the underlying weakness in the larger economy and markets, as the below chart shows quite well.
Source: PiperSandlerCornerstone
So...What's Next?
One of the founding principles of Resonant, which we try to return to with colleagues and clients consistently, is that it’s not enough to simply evaluate what’s happened in the past. We must be able to provide an informed opinion as to future probabilities and make investment decisions accordingly. To do this, we must be humble enough to recognize that we will often be incorrect, but that condition should not preclude further reflection, refinement and analysis. And at a minimum, while we may not know precisely where markets are going, we ought to at least have a firm grip on where we are (paraphrasing Howard Marks, like Markowitz, another great market researcher). We remain concerned about the sustainability of the stock market’s near-term performance, while we view the returns available in lower-volatility asset classes quite positively. Harry Markowitz would, perhaps, be proud of us. Our reasoning and analysis of current market and economic conditions are outlined below.
While corporate earnings have remained surprisingly resilient, they remain heavily-reliant on companies’ ability to pass on, and consumers’ willingness to bear, inflation-driven price increases. We are dubious this can continue unabated. Bank credit has tightened materially, and the yield curve is deeply inverted. These are both remarkably reliable predictors of recessions. The second quarter saw a federal government default narrowly averted, on the heels of multiple bank failures. And those bank failures prompted the Federal Reserve to quietly reverse one of their core policy courses, as they expanded their balance sheet by $300 billion. This stabilized the banking sector and provided temporary respite to many markets. But banks other than the largest ones have seen the strength of their balance sheets and those of many of their core customers diminish in recent months. Finally and importantly, the Federal Reserve also raised interest rates again during the quarter.
We are particularly concerned with commercial real estate and especially the health of regional banks and some of their most-important customers. We wrote last quarter about how the Fed is “crowding out” banks by driving up money market rates at the expense of bank deposits (and thus bank earnings). The resulting balance sheet weakness creates a further squeeze on those same banks, prompting additional regulatory scrutiny and (potentially) higher capital requirements. This negative feedback loop could well produce a credit crunch, with banks reducing lending so as to remain stable.
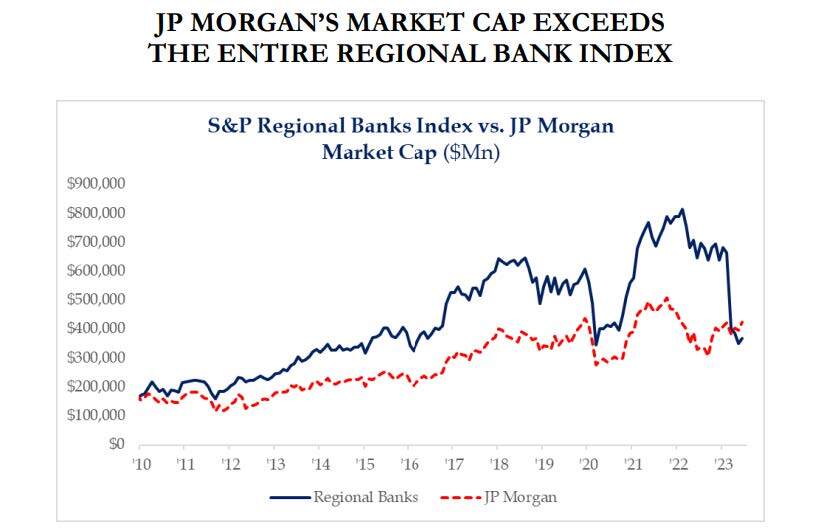
Lending standards lead the broader economy, and bank loans are a key support for nominal growth. If bank loan growth slows, so will nominal growth and thus the broader economy. Banks provide most of the lending on commercial real estate assets, and regional banks are most-affected. Regional banks hold close to $2 trillion of commercial real estate loans, which represent approximately one-fifth of their assets. An estimated $1.5 trillion of commercial real estate loans are due to be refinanced in the next 3 years, at dramatically higher rates. Coupled with the weakness in commercial office space demand and resulting lower rents, conditions in this very large but often-overlooked area of the economy have us monitoring the situation closely. Regional banks’ stock prices have already been negatively affected, and we are now beginning to see market disparities similar to those in other sectors, creating potentially outsized risk. As an example, JP Morgan’s market capitalization now exceeds the entirety of the KBW Regional Banking Index, as the chart below shows.
Source: Strategas
Our Conclusion
The market rally from the October 2022 lows seems at odds with economic and liquidity backdrop currently in place. Forward-looking data indicates to us that there are likely challenges ahead. Data we find compelling includes:
The deep inversion of the yield curve, which is a remarkably reliable predictor of recessions;
The deterioration of corporate earnings – we are of the view that the combination of continued high rates and persistently higher (than normal) inflation will ultimately impact margins and earnings;
Monetary conditions are tightening – Money supply (M2) has contracted nearly 5% year-over-year. This will slow the velocity of money and reduce inflation, but also stall the economy;
The Fed has raised the Fed Funds rate by 500 basis points (5%) and is most likely not done – indicating rates will be higher for longer than the investors are currently assuming (and pricing);
Monetary policy acts with long lag times – this will be exacerbated because consumers and corporations refinanced their debt near a historical low in interest rates. When that debt rolls over and has to be refinanced, debt service will consume more capital and negatively-impact both growth and earnings, which we are already seeing in leveraged real estate assets;
Quantitative Tightening (QT) has resumed. The U.S. Treasury is back to raising net debt – this had been temporarily suspended due to the collapse of Silicon Valley Bank;
Inflation is proving to be stickier than-expected – while it has trended lower, core inflation at 4.6% year-over-year remains well above the Fed’s long-term 2% target;
Bank lending standards have tightened considerably, reducing the availability of capital to businesses and consumers;
Unemployment has remained very low – it is presently at 3.6% and is driving wage inflation. Both of these items are important to the Fed, and allows them significant leeway to continue raising rates to slow the economy;
Student loan repayments restarting will represent a fiscal drag on consumer spending.
Our Positioning
Since 1950 the stock market has never bottomed before the start of a recession. Conditions now seem less than favorable for risk assets following a remarkably robust rally from a point of material weakness. Our first responsibility is to protect your capital, and from there to grow it. Our view is that, in light of the recent rally and the economic backdrop, discretion is the better part of valor in allocating capital today, particularly considering short term money market rates of approximately 5% are widely-available, and now generating yields above the rate of inflation. As a result, our portfolio models are generally at or below their long-term equity targets, remain biased toward value-based assets and have a tactical tilt away from the large cap domestic securities that have performed so well in the recent past.
Resonant Capital Advisors, LLC (“Resonant”) is an SEC registered investment adviser headquartered in Madison, Wisconsin. This communication is limited to the dissemination of general information and, accordingly, should not be construed, in any manner whatsoever, as a substitute for personalized individual advice from Resonant. Always consult an attorney, tax or financial professional regarding your specific legal, tax or financial situation.
This communication contains certain forward‐looking statements (which may be signaled by words such as “believe,” “expect” or “anticipate”) which indicate future possibilities. Due to known and unknown risks, other uncertainties and factors, actual results may differ materially from the expectations portrayed in such forward‐looking statements. As such, there is no guarantee that the views and opinions expressed in this communication will come to pass. Past performance is not indicative of future performance. Investing involves risk, including risk of loss.
This communication may also discuss and display charts, graphs and formulas which are not intended to be used by themselves to determine which securities to buy or sell, or when to buy or sell them. Such charts and graphs offer limited information and should not be used on their own to make investment decisions.
Although all information provided in this communication is gathered from sources deemed
to be reliable, we cannot guarantee the completeness or accuracy of such information. The information should not be regarded as a complete analysis of any subject discussed. All opinions included constitute the authors’ judgment as of the date of this communication and are subject to change without notice.
For additional information about Resonant, please request our disclosure brochure as set forth on Form ADV or refer to the Investment Adviser Public Disclosure web site (www.adviserinfo.sec.gov). Please read the disclosure statement carefully.