Equity markets advanced during the fourth quarter of 2025 despite macroeconomic and policy headwinds. These included a federal government shutdown, persistent tariff uncertainty, elevated large-cap valuations, and emerging signs of labor market softening. These challenges did little to undermine investor sentiment, and major equity indices posted solid gains for both the quarter and the full year.
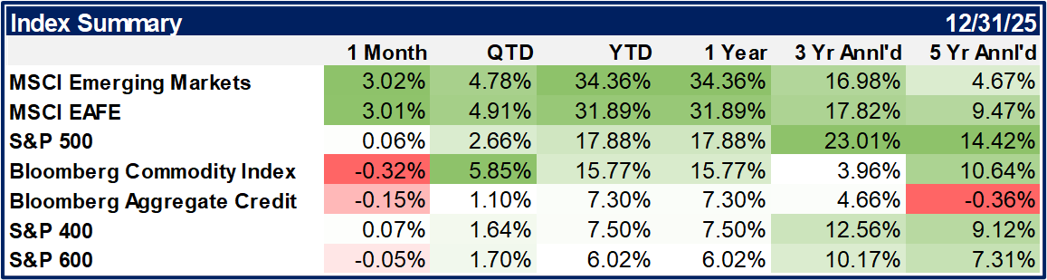
The S&P 500 delivered total returns of 2.7% in the fourth quarter and 17.9% for the year, marking a third consecutive year of double-digit returns. Market leadership remained concentrated in large-cap growth stocks, though performance within the so-called “Magnificent Seven” was uneven. The group reached a record 36% share of the S&P 500 in November, driven primarily by strong gains in Alphabet and Nvidia, while the remaining five constituents underperformed the broader market in 2025.
Data Source: YCharts
Mid- and small-cap equities delivered more modest—but still positive—results. The S&P MidCap 400 gained 1.6% for the quarter and 7.5% for the year, while the S&P SmallCap 600 advanced 1.7% and 6.0%, respectively. Two separate 25 basis point (0.25%) rate cuts by the Federal Reserve supported risk assets broadly, while increased scrutiny of AI-related capital expenditures and infrastructure debt financing encouraged portfolio diversification. As a result, small- and mid-cap indices outperformed the S&P 500 during the final two months of the year, a trend not fully reflected in full-quarter returns.
International equities delivered even stronger performance. The MSCI EAFE Index rose 31.9% for the year and 4.9% in the fourth quarter, while the MSCI Emerging Markets Index gained 34.4% and 4.8%, respectively.
Fixed income markets benefited from declining interest rates. The U.S. 10-year Treasury yield fell approximately 40 basis points (0.40%) during the year, ending at 4.17%—its first annual decline since 2020. Lower yields supported positive returns across both government and credit sectors, with the Bloomberg U.S. Aggregate Government/Credit Index posting gains for the quarter and the year.
Commodities also strengthened meaningfully. The Bloomberg Commodity Index rose 15.8% in 2025 and 5.8% in the fourth quarter. Precious metals were standout contributors, with spot gold up 64.6% and silver posting a remarkable 148% annual gain.
The Wealth Effect – At A Tipping Point?
As we turn over a new year, the continued rise in equity prices and asset valuations calls for caution, which we examine through several lenses across the economy and global markets in the pages that follow.
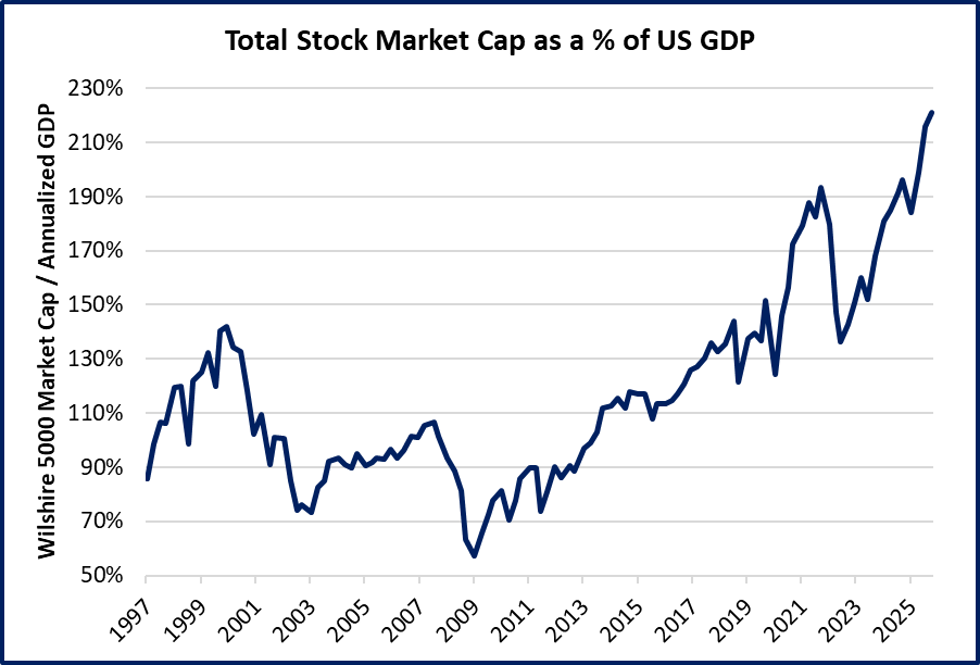
U.S. stock market capitalization as a percentage of GDP (depicted below) measures the total value of publicly traded equities relative to overall economic output. Commonly referred to as the “Buffett Indicator,” this metric was popularized by investor Warren Buffett, who has described it as one of the most reliable gauges of market valuation at any given point in time.
Data Source: Factset
Driven by strong AI – related momentum, the gap between market valuations and economic output is now at a record high. As depicted in the chart above, by the end of 2025, this ratio reached approximately 218%, a reading that surpasses the peaks observed in 2000 and 2021 and stands well above the “New Era” median of 107%. The current level of the “Buffet Indicator” warrants caution, as similar peaks have historically preceded significant market corrections. While valuation excess tends to build gradually, reversals often occur swiftly. The question we are examining now is whether today’s unprecedented level of wealth tied to the stock market could make the next correction more severe.
Higher asset prices often trigger a “wealth effect,” encouraging households to spend more and take on additional risk, whereas declines prompt restraint and lower consumptions. Three consecutive years of strong S&P 500 performance have reinforced this dynamic: higher asset prices boost household wealth, confidence rises, risk-taking increases, capital flows into markets, and prices advance further. The wealth effect is particularly strong in the United States, where widespread participation in workplace retirement plans has increased equity exposure. This makes financial assets a significant component of household wealth and supports incremental discretionary spending, which is a proxy for consumer risk tolerance generally.
A notable example of increased risk taking occurred last fall when Gustav Klimt’s Portrait of Elisabeth Lederer (pictured right) sold for a record $236.4 million at Sotheby’s, becoming the most expensive modern piece ever sold at auction and represented the second-highest price for any artwork in history. The same auction also saw an 1887 Vincent Van Gogh piece sold for $62 million and a Frida Kahlo self-portrait fetch $54.7 million. Whether these sales represent peak “wealth effect” behavior is still uncertain. For the buyer, of course, such considerations may be secondary; beauty, after all, lies in the eye of the beholder.
The Flip Side of the Coin – Consumer Doldrums
While the wealth effect has broadly sustained consumer spending and the broader economy, there are signs of weakness beneath the surface, as not all households and consumers have seen the positive leverage of housing and financial asset appreciation.
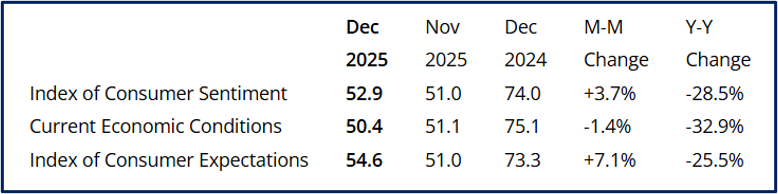
As a result, consumer sentiment (according to the University of Michigan’s survey, shown below) is still about 30% below where it was in December of 2024
Potential causes of low and/or declining sentiment likely include:
Limited Stock Market Participation - While household stock ownership has increased, a sizable portion of Americans remain uninvested in equities.
Persistently High Prices - Inflation has cooled, but overall price levels remain well above pre-2021 benchmarks.
Housing Affordability Challenges - Mortgage rates have declined, yet home prices remain elevated, limiting accessibility for buyers.
Wage Perception Gap - Real wages have improved, but many workers feel they are merely catching up after years of inflation outpacing earnings, rather than getting ahead.
For households with limited or no participation in the recent equity market rally, the rising cost of living remains a primary driver of their economic sentiment. As inflation continues to moderate, we may begin to see a gradual improvement in this group’s outlook as real purchasing power stabilizes. While concerns about an extended bull market are understandable at this stage of the cycle, it is worth noting that historically, periods of subdued consumer sentiment have often preceded strong equity market performance. For long‑term investors, this dynamic reinforces the importance of maintaining a disciplined investment framework and avoiding sentiment‑driven decisions.
Scanning for Black Swans – Private Credit
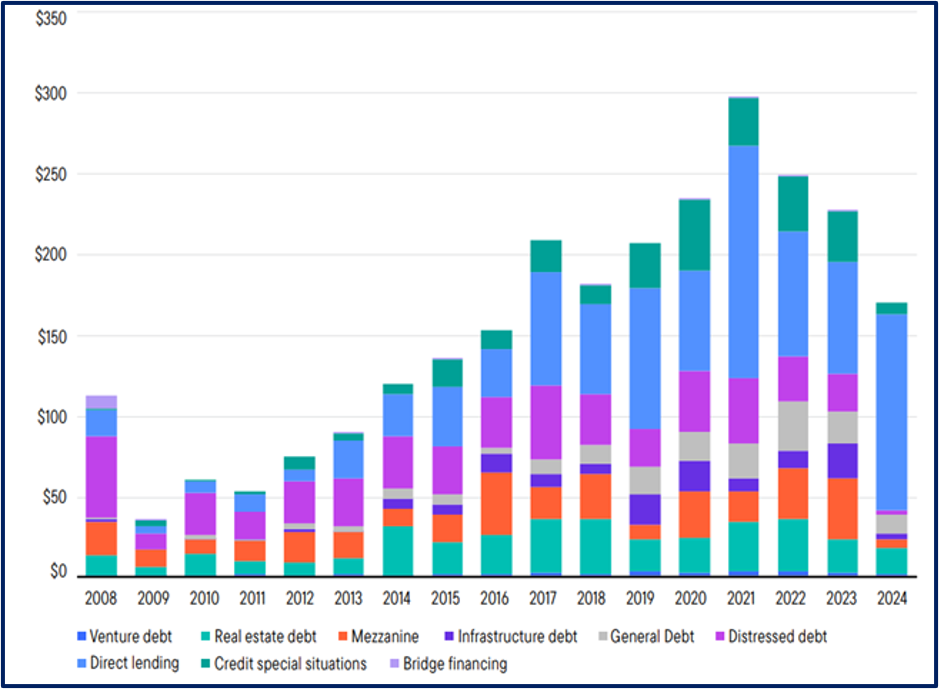
We have been watching closely for some time the remarkable growth of the marketplace variously referred to as “private credit”, “leveraged loans” or the remarkably benign “Business Development Corporations.” One outcome of the Great Financial Crisis and the subsequent intervention of the Treasury Department, Fed and global monetary authorities was that in creating a subset of banks that were deemed “Too Big to Fail,” those same institutions were also broadly de-risked. The ensuing and extended period of low interest rates and modest loan growth by insured institutions, shaped by this new pattern of regulatory influence created a now-enormous market made up of a variety of loan types made by “Non-Depository Financial Institutions” in what is sometimes referred to as the “Shadow Banking System.”
Global Private Debt Capital Raised by Type (as of September 2024)
Source: CAIA, Pitchbook
Evolution isn’t necessarily a bad thing, and in many cases access to different types of credit facilities has been very good for the private economy. A case in point is that fewer companies are going public and so they need access to less-traditional financing for longer. However, almost all financial crises historically have been rooted in credit-related excesses, and where growth at these types of rates is occurring in areas of the economy that are both opaque and leveraged, we pay close attention. The recent bankruptcies of two distinct automotive-related companies, First Brands and Tricolor, displayed a number of troubling signs, including:
Fast-growing conglomerates financed by private equity and debt with significant leverage at multiple levels;
Off-balance sheet activity and opaque disclosures masking additional debt-based leverage (“factoring” of accounts receivable);
A mid-tier Wall Street investment bank (Jefferies) sitting in the middle with significant exposure at multiple levels;
Securitization and packaging of the credit facility(ies) for broader distribution to funds and investors, some themselves levered;
Debt and equity exposure from large, publicly traded financial institutions, including BlackRock and J.P. Morgan but also multiple regional and sub-regional banks;
Fraudulent behavior by corporate actors at the borrowing firm(s);
A lack of regulation and opacity in the marking of the value of debt and equity instruments, and finally;
A softening consumer economy (the end customer) surfacing issues that quickly spread to others involved directly and indirectly with the company(ies) themselves.
The larger stock and bond markets have largely absorbed and shrugged off, in the near term, these warning signs. This is due in part to the market’s perception that the Fed will continue to lower rates, providing immediate relief to investors. Still, we are of the opinion that the entirety of this story is not yet written. Business Development Corporations’ publicly traded stocks, as represented by the Van Eck BDC Income ETF (BIZD) overcame significant bouts of volatility at multiple points during the year but still closed down -16.6% in a year where nearly everything else worked.
Jamie Dimon turned a phrase that is likely to be memorable, when he said of this series of issues “…when you see one cockroach, there are probably more…Everyone should be forewarned on this.” First Brands had $2.3 billion of unpaid loans and J.P. Morgan took a $170 million loss already. When value and liquidity vanish so quickly and unexpectedly, we take notice. We are paying particularly close attention to credit spreads in the fixed income markets and monitoring for additional contagion potential across asset classes even though our portfolios have no direct exposure to private credit.
Japanese Bond Yields Surge: Why it Matters
In contrast to declining U.S. interest rates, Japan’s benchmark 10-year government bond (JGB) yield rose 1% in 2025, ending the year at 2.07%—its sharpest annual increase since 1994.
For more than a decade, Japan’s bond market had been characterized by extraordinary stability, with yields anchored near zero. The recent surge reflects a combination of monetary policy normalization, fiscal expansion, and shifting market dynamics. The Bank of Japan (BoJ) ended yield curve control and began quantitative tightening by reducing its bond holdings, removing a significant source of demand, and allowing market forces greater influence over long-term rates. The BoJ also raised its policy rate from near zero to 0.75%, the highest level in 30 years.
At the same time, a new administration implemented expansionary fiscal policies, including stimulus measures and tax cuts, which boosted bond issuance and heightened concerns about debt sustainability. Japan’s debt-to-GDP ratio is still among the world’s highest—exceeding 200%— and has long been manageable due to near-zero interest rates, but that era may be ending.
As the BoJ tapers its purchases, JGB demand increasingly depends on foreign investors, who typically require higher yields to compensate for perceived risk. Rising Japanese yields carry global implications. A narrowing yield differential between Japan and the U.S. or Europe could reduce incentives for Japanese institutions to invest abroad, potentially dampening demand for U.S. Treasuries and placing upward pressure on yields domestically and abroad. In addition, higher Japanese rates diminish the appeal of the traditional yen carry trade—borrowing in low-yielding yen to invest in higher-yielding assets elsewhere—which could reduce leverage in global markets and contribute to tighter financial conditions.
Finally, as borrowing costs rise, Japan now faces challenges that analysts once viewed as uniquely avoidable. With interest rates climbing, attention turns to whether the Bank of Japan can manage these pressures without destabilizing financial markets. We have written often over the years about the U.S. Treasury market and the interplay between fiscal/monetary policy and the pricing of risk as represented by Treasury yields. Japan is overlooked by many investors but bond markets, and bond investors, have proven remarkably prescient at identifying the mispricing of risk. We are monitoring the Japanese market dynamics for this reason, but also for the potential parallels domestically.
Portfolio Positioning
Our investment approach remains disciplined and balanced. We are mindful of elevated valuations and signs of labor market cooling, while also recognizing the positive backdrop of resilient earnings, easing inflation pressures, and supportive policy conditions. We believe improving fundamentals and more reasonable valuations among small- and mid-sized companies may support broader market participation going forward. We added to these asset classes in our portfolio models during the year, but had to wait until the fourth quarter to see sustained outperformance as investors rotated away from the AI trade.
We had made a similar determination regarding the relative attractiveness of international equities, and these markets rewarded investors in 2025. They continue to offer reasonable relative value, even after their impressive performance in 2025. In terms of fixed income, we have kept a focus on high quality and short-to-intermediate maturities, reflecting our expectation that interest rates will remain within a stable range.
Some readers may have seen coverage at the end of the year that Merriam- Webster’s 2025 word of the year is “slop.” But the dictionary publisher is not talking about pig food. Instead, this version defines slop as “digital content of low quality that is produced usually in quantity by means of artificial intelligence.”
Evidently, in 2025 Americans ingested copious amounts of slop by watching endless hours of AI generated videos, listening to AI generated songs, and reading poorly-written letters, books, and reports. When The Wall Street Journal warned “AI Slop is Everywhere” Americans shrugged and kept consuming.
Markets, meanwhile, are working to assess the price of rapidly accelerating technology while navigating the early volatile phase of a structural transformation. Turbulent market and economic transitions can get sloppy (no pun intended). We believe however, that human creativity, thoughtful conversations and investment experience can be an antidote to slop. We look forward to continuing to help you take part in long-term market growth while navigating and managing risks thoughtfully.
Resonant Capital Advisors, LLC (“Resonant”) is an SEC registered investment adviser headquartered in Madison, Wisconsin. This communication is limited to the dissemination of general information and, accordingly, should not be construed, in any manner whatsoever, as a substitute for personalized individual advice from Resonant. Always consult an attorney, tax or financial professional regarding your specific legal, tax or financial situation.
This communication contains certain forward‐looking statements (which may be signaled by words such as “believe,” “expect” or “anticipate”) which indicate future possibilities. Due to known and unknown risks, other uncertainties and factors, actual results may differ materially from the expectations portrayed in such forward‐looking statements. As such, there is no guarantee that the views and opinions expressed in this communication will come to pass. Past performance is not indicative of future performance. Investing involves risk, including risk of loss.
This communication may also discuss and display charts, graphs and formulas which are not intended to be used by themselves to determine which securities to buy or sell, or when to buy or sell them. Such charts and graphs offer limited information and should not be used on their own to make investment decisions.
Although all information provided in this communication is gathered from sources deemed
to be reliable, we cannot guarantee the completeness or accuracy of such information. The information should not be regarded as a complete analysis of any subject discussed. All opinions included constitute the authors’ judgment as of the date of this communication and are subject to change without notice.
For additional information about Resonant, please request our disclosure brochure as set forth on Form ADV or refer to the Investment Adviser Public Disclosure web site (www.adviserinfo.sec.gov). Please read the disclosure statement carefully.