The first quarter of 2026 began with a pronounced shift in market dynamics. Following nearly three years of strong Artificial Intelligence-driven enthusiasm, investor sentiment turned cautious amid growing concerns about AI’s potential to disrupt existing business models and the significant infrastructure investment required to support its expansion. Against a “Goldilocks” economic backdrop - steady growth and easing inflation – and with rising expectations for rate cuts, market participation broadened meaningfully across U.S. market capitalizations. International and Emerging Markets began the quarter on stronger footing as well, benefitting from a weaker U.S. dollar and attractive relative valuations. Treasury yields drifted lower and gold reached historic highs.
This narrative was abruptly disrupted late in the quarter as rising tensions and then military conflict in Iran commanded investor attention, resulting in a risk-off sentiment shift and a materially different market environment. Oil prices surged over 50% and became the primary driver of market action. U.S. and foreign equites faced pressure as the energy shock weighed on investor sentiment. The inflation narrative shifted from anticipating rate cuts to contemplating potential hikes. The 10-Year Treasury yield spiked to an intra-quarter high of 4.44%.
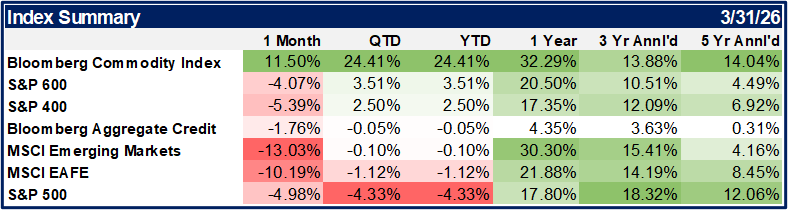
Despite a late quarter rally, the S&P 500 could not overcome the negative headlines and declined -4.3%, marking its worst quarter since 2022. Beneath the surface, large-cap growth stocks served as a source of capital, creating selling pressure that resulted in one of their poorest relative performances versus value on record. In contrast, the market rotation noted above favored smaller capitalization stocks, with the S&P400 Midcap Index rising 2.5% and the S&P 600 SmallCap Index gaining 3.5%. After a strong start to the quarter, international markets finished the quarter modestly lower, with the MSCI EAFE Index slipping -1.1% and the MSCI Emerging Markets index edging down -0.1%. The 10-Year Treasury yield moved higher, ending the quarter near 4.3%. The upward pressure on rates dragged the Bloomberg Intermediate Govt/Credit Index down -0.05% and the Bloomberg Municipals 1-10yr Blend Index down -0.23%. The standout performer of the quarter was the Commodities sector, which led all major asset classes with a significant 24.4% gain, driven largely by the supply concerns stemming from the war in the Middle East.
Clients may have noticed that we typically reference S&P 500, 400, and 600 indices when discussing domestic equity performance, yet client portfolio benchmarks have historically been built using the Russell 3000. This was a practical decision made at the firm's inception, driven by data limitations in our reporting software at the time. In practice, we have always evaluated performance against the S&P indices and constructed portfolios using S&P-based ETF products, because the S&P indices apply a quality and profitability screen for inclusion that the Russell indices do not. This quality bias has always aligned more closely with how we think about markets and portfolio construction. Effective this quarter, client portfolio benchmarks have been updated to reflect S&P indices across the board — a change we believe brings our reporting into closer alignment with our investment philosophy. That same philosophy, focused on quality, resilience, and fundamentals, is what guided our positioning decisions during one of the more turbulent quarters in recent memory.
Observations on the Iran Conflict
The situation in Iran remains highly fluid. While markets have shown great resilience, the duration and scope of the conflict will ultimately determine the long-term impact on growth. As of this writing, the U.S. and Iran have tentatively agreed to a ceasefire with each side outlining separate plans for future negotiations. While both parties claim victory, the proposals remain significantly misaligned, making the agreement tenuous at best.
Both plans include reopening the Strait of Hormuz, a critical shipping route that historically carried roughly 20% of the global petroleum supply. Last year, traffic through the Strait averaged approximately 135 crossings per day. This slumped to an average of just 3 per day in March. Even if a potential ceasefire holds and longer-term agreements are reached, near-term oil constraints are likely to persist and prices are likely to remain higher for longer. Some production remains offline, transit through the Strait will take time to normalize, and shipping delays will extend delivery timelines, not to mention the demand destruction that has occurred while the Strait has been shuttered for over a month. These factors are expected to continue rippling through global supply chains and the broader economy with potential implications for inflation and growth.
Over the intermediate term, additional demand for oil and petroleum is likely as countries work to rebuild depleted reserves. Coupled with tighter supply, this makes a return to pre-conflict oil prices unlikely in the near term. Weighed against the energy-related risks, we highlight three factors that underpin our comfort in holding course with our portfolio asset allocations during this period of volatility: the historical resilience of equity markets through oil shocks, the structural support of defined contribution flows, and an earnings picture that has not broken down.
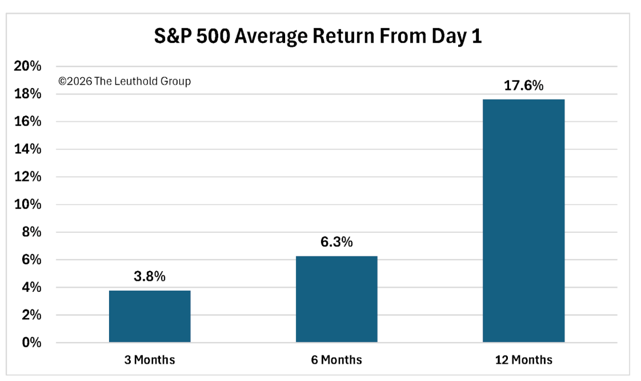
The launch of Operation Epic Fury represents the latest in a long history of geopolitical events that have triggered significant oil price shocks. Our research partners at Leuthold Group recently published a study examining 15 instances in which oil prices rose more than 20% for at least 30 days, with a particular focus on the subsequent impact on equity markets. Notably, as illustrated in the chart below, the S&P 500 more often posted positive returns following such episodes. As the initial risk-off sentiment faded, markets recognized that elevated oil prices were not signaling an economic collapse. Instead, equity returns over the subsequent 3-, 6-and 12-month periods were all positive.
Rise of the DC Plans
The shift of the U.S. retirement system toward defined contribution (DC) plans has created a large, steady, and increasingly influential source of equity demand. Unlike discretionary investment capital, DC contributions are predictable, driven by employment and wage growth rather than market sentiment or valuations. With contribution rates typically around 10–15% of income, including employer matches, these plans generate consistent inflows even during periods of market uncertainty. Today, DC plans represent a multi‑trillion‑dollar pool of assets, with annual contributions estimated at roughly $1 trillion and a significant portion directed toward equities.
Why does this matter? Most defined contribution (DC) assets are invested through passive strategies and target‑date funds, resulting in allocations that are driven mechanically by market capitalization. This structure disproportionately benefits larger‑cap stocks and reinforces market leadership. Of the roughly $65 trillion U.S. equity market, roughly $55 trillion is represented by the S&P 500, with the remainder split between small‑ and mid‑cap stocks. As a result, the majority of annual DC contributions flow into large‑cap equities. We believe these steady, price‑insensitive inflows likely contributed at the margin to the bifurcated market performance seen over the past three years. While leadership has recently begun to rotate away from large caps, the persistent nature of DC flows continues to influence market behavior. Importantly, these countercyclical inflows also support market resilience, helping to dampen headline‑driven volatility and accelerate recoveries, even though they do not eliminate the risk of future bear markets.
Earnings Power and Corporate Resilience
Despite the turbulence of the past quarter, the fundamental earnings picture for American companies has remained more constructive than headlines might suggest. S&P 500 operating earnings grew 15% in 2025, the strongest annual growth rate since 2021, and estimates for the first quarter of 2026 continued to rise through March, even as geopolitical uncertainty mounted. The ratio of companies reporting higher year-over-year earnings versus lower reached 1.65 at the close of Q4 reporting, its best reading in four years and, notably, the third consecutive quarter at that level.
Source: Factset
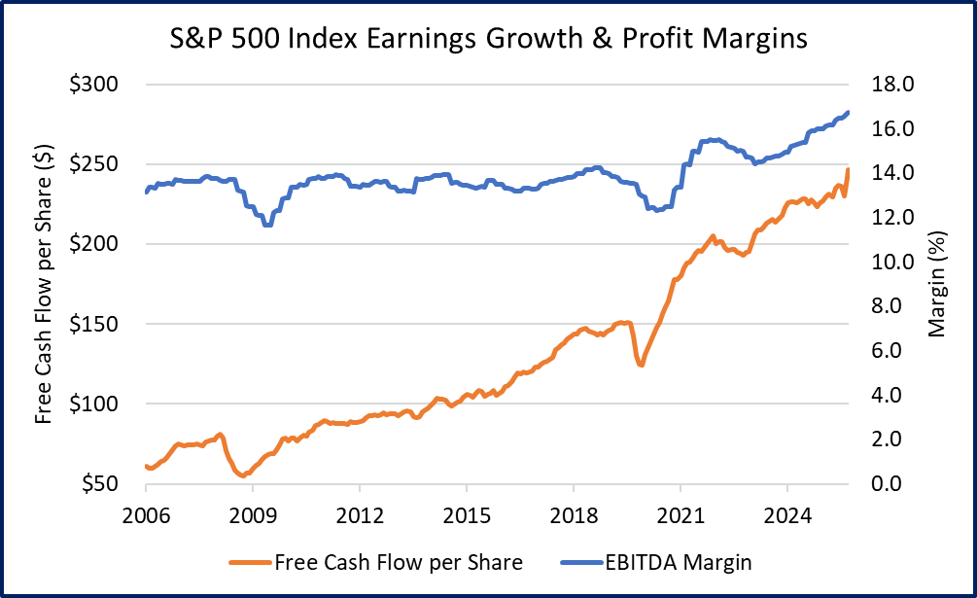
Corporate profit margins, often a casualty of an energy shock, have inspired more confidence than many feared as oil began its climb. The modern U.S. economy, more service-based and less energy-intensive than in prior decades, is simply better equipped to absorb these shocks than it once was. The chart above depicts the corporate margin expansion and growth in free cash flow over the last 20 years that depicts this trend.
Further, energy spending as a share of personal consumption has fallen from over 9% following the 1970s oil shocks to roughly 3.5% today, which means the same proportional move in oil prices carries meaningfully less weight on corporate cost structures and consumer wallets than it once did. Large-cap businesses in particular have demonstrated a consistent ability to protect margins through pricing power, operational efficiency, and diversified supply chains.
While valuations are still above long-run historical averages and are something that we pay close attention to, they have receded from their peaks. The S&P 500's forward price-to-earnings ratio dipped below 20x at the end of the quarter for the first time since 2023. This dip occurred after multiples topped 23x in the fourth quarter of last year, the highest level since the height of the COVID pandemic disruptions. The market has become a somewhat better deal than it was, even as the underlying business case for owning equities has not fundamentally deteriorated. When paired with the structural demand support from defined contribution plans described above, a diversified equity portfolio continues to offer a reasonable case for long-term investors willing to accept near-term volatility in pursuit of long-term growth.
Oils Cost Down to the Penny
The United States Mint has finally concluded that the penny is no longer worth its weight in copper. First issued in 1793, the penny was created in an era when metal was inexpensive, labor was manual, and energy costs were barely a consideration. Today, each penny represents a small, loss- making energy trade. Oil is not merely another commodity; it is a foundational driver of inflation. Rising oil prices reverberate through every step of the production process: mining zinc and copper is energy intensive; transporting raw materials and finished coins requires fuel; smelting and minting demand significant power. As energy costs rise so does the fully loaded cost of producing a penny, which already stands at roughly 2.5 to 3 cents per coin. With production unprofitable even before the recent oil shock, the decision to end minting has become even more economically compelling. This underscores what markets are repricing in other areas at present: oil’s influence on productions costs and its persistent inflationary effects.
Ending production won’t make pennies disappear overnight. They’ll remain for years, tucked away in jars, drawers and car seats. And while the coin itself may fade from circulation, familiar sayings like “a penny for your thoughts”, “a penny saved is a penny earned” and “don’t be penny wise and pound foolish” are likely to endure. In the end, the penny’s legacy is less about its monetary value and more about its sentimental role in teaching generations about saving and thrift.
Portfolio Positioning
The dynamics described above (an energy shock of historic proportions, a dollar strengthening against fragile foreign economies, and a Fed with limited room to respond) have shaped our portfolio decisions in the last six months as much as any single data point. We made targeted adjustments in our model portfolios during the quarter to reflect both the risks and the opportunities that environment created.
We modestly increased commodity exposure to benefit from energy-related tailwinds, trimmed small and mid-cap positions following strong performance, and selectively added to large-cap growth where fundamentals had become more attractive. We also reduced international exposure in response to a strengthening U.S. dollar and the expected impact of higher oil prices on foreign economies. Within fixed income, we closely managed duration and credit exposure given rising yields and tightening financial conditions.
As we move into Q2, our positioning reflects continued caution around energy-sensitive exposures and international markets, while we remain alert to the rotation opportunities a lasting ceasefire or diplomatic resolution could create. In our last letter we wrote that the stock market tends to climb the proverbial wall of worry and look beyond near-term risks. That tends to be the case if there is confidence in the longer-term picture, and we are witnessing that play out at the time of writing. Discussion of a potential ceasefire, even if short-lived or haphazardly followed, has helped equities "round trip" the losses experienced thus far through this conflict.
While we diligently weigh the near-term risks, we remain constructive on our positioning in the markets over our investment horizon and believe a well-diversified portfolio is the right posture for navigating whatever path resolution, or prolonged conflict, ultimately takes. Even in a scenario where the conflict proves more protracted and oil constraints more persistent than markets currently anticipate, we believe the combination of durable earnings, structural equity demand, and a portfolio already biased toward quality and domestic exposure represents a prudent path forward, rather than further trades based on uncertainty. The pendulum of investor psychology swings perpetually between fear and greed, and our goal is to make decisions that are anchored in fundamentals rather than driven by where that pendulum happens to be on any given day.
Resonant Capital Advisors, LLC (“Resonant”) is an SEC registered investment adviser headquartered in Madison, Wisconsin. This communication is limited to the dissemination of general information and, accordingly, should not be construed, in any manner whatsoever, as a substitute for personalized individual advice from Resonant. Always consult an attorney, tax or financial professional regarding your specific legal, tax or financial situation.
This communication contains certain forward‐looking statements (which may be signaled by words such as “believe,” “expect” or “anticipate”) which indicate future possibilities. Due to known and unknown risks, other uncertainties and factors, actual results may differ materially from the expectations portrayed in such forward‐looking statements. As such, there is no guarantee that the views and opinions expressed in this communication will come to pass. Past performance is not indicative of future performance. Investing involves risk, including risk of loss.
This communication may also discuss and display charts, graphs and formulas which are not intended to be used by themselves to determine which securities to buy or sell, or when to buy or sell them. Such charts and graphs offer limited information and should not be used on their own to make investment decisions.
Although all information provided in this communication is gathered from sources deemed
to be reliable, we cannot guarantee the completeness or accuracy of such information. The information should not be regarded as a complete analysis of any subject discussed. All opinions included constitute the authors’ judgment as of the date of this communication and are subject to change without notice.
For additional information about Resonant, please request our disclosure brochure as set forth on Form ADV or refer to the Investment Adviser Public Disclosure web site (www.adviserinfo.sec.gov). Please read the disclosure statement carefully.